
Challenges & Solutions in Today’s In Vitro Transporter Research
- Drug Transporters
- August 30, 2018
- Michael Millhollen, Dr. Joanna Barbara
Transporters are membrane-bound proteins that govern the passage of drugs into and out of cells. These gatekeeper proteins can be key determinants of drug pharmacokinetics, safety and efficacy. In vitro drug transport assays are performed throughout drug development and range from simple permeability screens to kinetic assessments in complex assay formats.
New considerations for interpreting transporter assay results
When the 2017 FDA drug-drug interaction (DDI) guidance was released, our team coordinated a cohesive tactical response. Certain new recommendations speak to practical considerations regarding data handling. Sometimes interpreting transporter assay results is straightforward, and sometimes applying the data to make smart decisions is challenging. To us, as frequent practitioners of these assays, the updated considerations make sense. In fact, some of us have been applying some of these concepts to our transporter studies for a long time.
Specifically, the new guidance calls for more rugged transporter study designs that consider:
- Stability of the test system
- Nonspecific binding to cells and experimental apparatus
- Solubility limits
- Effect of additive serum proteins
- Effect of prefiltration
- Effect of cytotoxicity
- Effect of other experimental steps
Help for unclear data: a case study
With transporter assay data that is not straightforward, examining one or more of the factors above may help you find your way forward.Consider a client’s solute carrier protein (SLC) inhibition study looking at renal and hepatic uptake and efflux transporters.
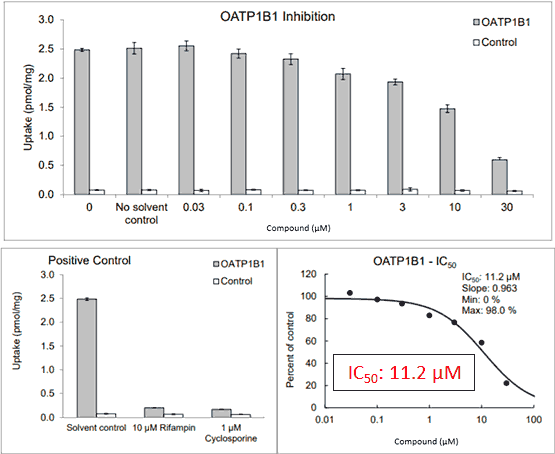
The basic process: A transporter-transfected cell line (gray bars) and non-transfected control cells (white bars) were each incubated with a constant amount of probe substrate in the presence of test compound at various concentrations. The goal was to see whether changes in drug concentration altered uptake of the probe substrate.
Figure 1. Uncorrected data*

Figure 1 shows a positive result for transporter inhibition: Uptake by OATP1B1 was inhibited by the test compound, with a concentration-dependent response yielding an IC50 (definition) of 11.2 µM.
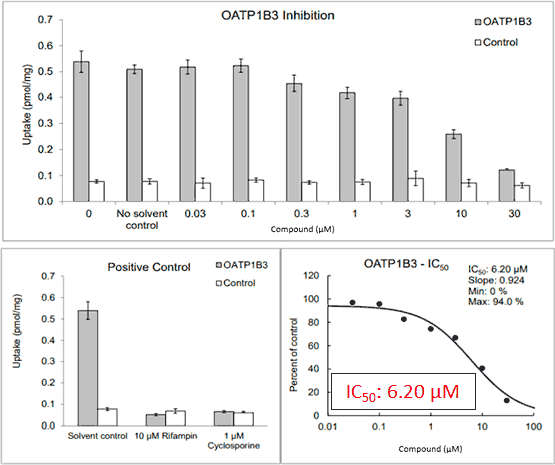
Figure 2*

First level interpretation
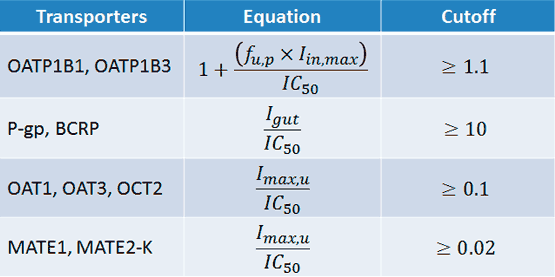
To evaluate the need for further clinical studies, we start with the FDA’s basic static model for transporters, using the following equations and cutoff values (Figure 3).
Figure 3

IC50 = the half-maximal inhibitory concentration
Iin,max = the estimated maximum plasma inhibitor concentration at the inlet to the liver
Igut = the intestinal luminal concentration estimated as dose/250 mL
Imax,u = the maximal unbound plasma concentration of the interacting drug
Sometimes, if not all variables are known, assumptions may be made. When the relevant equation yields a result ≥ the cutoff value, further investigation is recommended.
An aside: non-specific binding, a new FDA consideration
Before we discuss these calculations, however, let’s examine some compound recovery data for signs of nonspecific binding (NSB). At high and low concentrations, the compound was incubated for 30 minutes with and without control cells and then analyzed by LC-MS/MS (Figure 4).
Figure 4*

Calculating for DDI potential
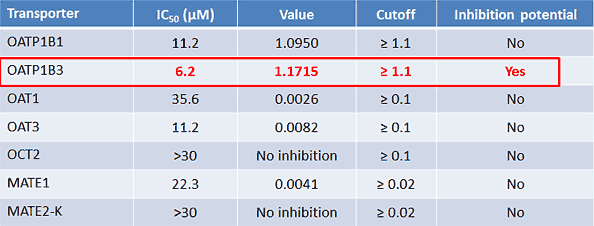
Keeping the NSB issue in mind, we perform the standard calculations using our measured IC50s and client-provided data.
Figure 5*

But won’t losing half of our material make a difference? The theoretical compound concentrations experienced by the cell are not representative of the experimental concentrations. After discussions with our client, we decided that the best and fastest option for this case was the simplest approach: recalculate, given the worst-case scenario. In other words, if we lost 50% of the material, and the IC50 were 3.1 rather than 6.2 µM, how would that change our calculations?
The new, NSB-corrected OATP1B1 R value is 1.1899, which is greater than 1.1 and means OATP1B1 also must undergo further inhibition studies. Understanding this requirement early and simply adding a second transporter to the OATP1B3 work is much less costly than performing a second study later.
Putting the new guidance to work in your research
Scrutinizing all the factors impacting your transporter assay will help you understand your data and make appropriate decisions moving forward. The considerations newly highlighted in the 2017 FDA DDI guidance should improve your ability to interpret transporter data effectively and move your compound forward.
When in doubt, and for the best results, don’t hesitate to partner with the experts at XenoTech.
Listen to an in-depth discussion of this and other transporter case studies
Learn more about:
About the Authors
Related Posts
AAPS-FDA Drug Transporters
ADME and Drug-Drug Interactions for the Toxicologist
Subscribe to our Newsletter
Stay up to date with our news, events and research

Do you have a question or a request for upcoming blog content?
We love to get your feedback
